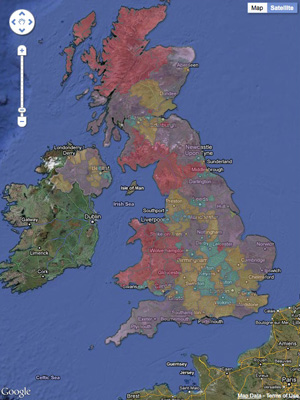
Ofcom has launched an interactive map of the UKs broadband, as part of its every-three-year report to the Government. The map enables users to view information about a number of different statistics - including the average speeds, and broadband take-up - in different areas, and compare them to the rest of the UK.
The data used has been collected from 201 administrative authorities in the UK, and ranks them in four areas: average broadband take-up, the percentage of users receiving under 2Mb/s, superfast broadband availability, and the average modem sync speed. These four areas are combined into an overall score.
Ofcom Chief Executive, Ed Richards, said: "We are now developing a clear picture of the UK's fixed broadband infrastructure and how it delivers for consumers. We hope that this information will stimulate further rollout of broadband infrastructure and better performance for households and businesses."
Unsurprisingly it is regions with a lot of rural areas that lose out, with 14 per cent of customers with fixed-line broadband receiving a service of under 2Mb/s. At the top of the chart are densely populated cities, such as Edinburgh and Bristol, with average speeds of 10.1MB/s and 9.9Mb/s respectively.
It's worth noting, that Ofcom has made the raw data available on its website, so third parties can use it for their own purposes - as well as creating this map itself. Ofcom will be submitting its first infrastructure report to the Secretary of State later this year, and the production of this map is a result of a request from the Government for Ofcom to provide information on the data it shows - that it's available in this easy to digest form is an added bonus.