UL Benchmarks is pleased to announce that PC gamers submitted over a million benchmark results with 3DMark last month. Hoping to build on this milestone, the benchmark maker has some interesting additions to the testing suite, purposed to provide more meaningful comparisons, and give a better indication of AAA gaming performance. UL Benchmarks has thus revamped 3DMark and its UI to provide two key changes:
- Making it easy to compare your benchmark results against users with other systems using the same components,
- Providing estimates for real-world gaming performance in a selection of popular games.
The above features are surfaced from the all-new results screen, pictured below. With regard to benchmark score comparisons a graph shows the distribution of scores from people who have the same CPU and GPU combo. Your own result will be indicated by a green vertical line slicing the bell curve. "If your score is close to the average, it means your PC is working as it should. A score well below the average could indicate a hardware or configuration problem." UL Benchmarks explained in its email to HEXUS. "The best score gives you an idea of the overclocking potential of your setup".
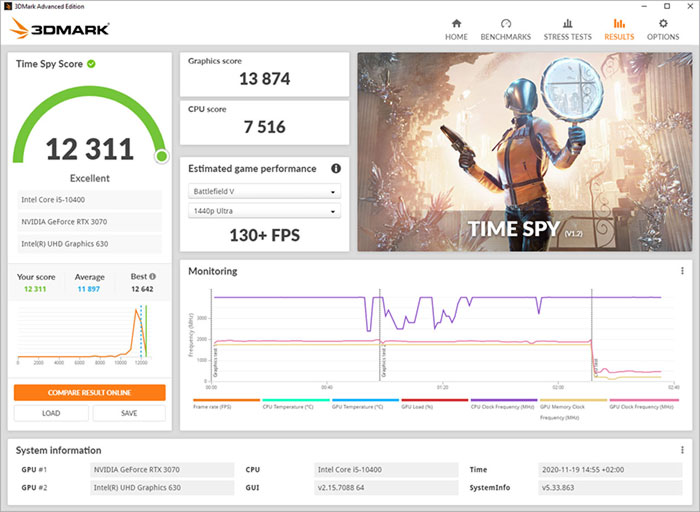
In the middle section of the new results UI, directly beneath your benchmark graphics and CPU scores you will find the estimated game performance tool. In this first release with this feature, 3DMark has integrated estimates for five games; Apex Legends, Battlefield V, Fortnite, GTA V, and Red Dead Redemption 2. Additionally you can check either the 1080p Ultra or 1440p Ultra settings. None of these settings include raytracing features turned on. Behind this feature is "extensive data from UL’s in-house testing".
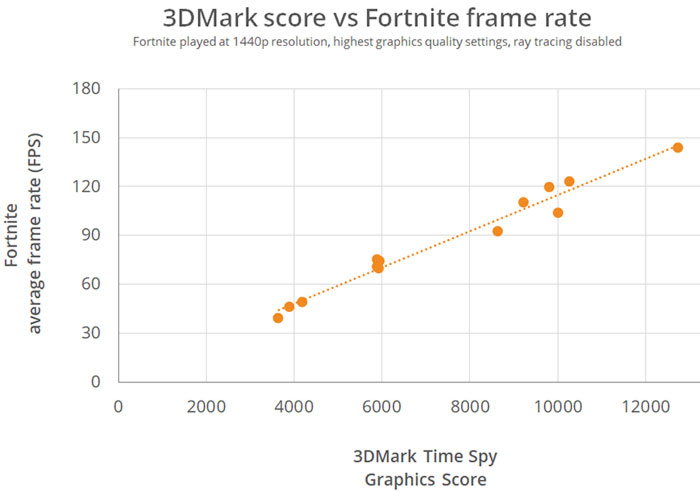
Backing up its game performance estimate intelligence claims, UL Benchmarks says it tests hundreds of PC systems for retail partners and you can see the chart above which plots 3DMark score vs Fortnite frame rate to see a clear relationship.
Availability
The revamped 3DMark is available now via the usual channels. You will need the Advanced Edition or better for game performance estimates. At the time of writing this edition is 85 per cent off (US$4.49) via Steam or the UL Benchmarks website (until 1st Dec).