


Testing methodology
GPU comparisons |
|||||||
|---|---|---|---|---|---|---|---|
| Graphics card | Approx. pricing |
GPU clock (MHz) |
Stream processors |
Shader clock (MHz) |
Memory clock (MHz) |
Memory bus (bits) |
Graphics driver |
| Gigabyte GeForce GTX 590 (3,072MB) | £575 | 607 | 1,024 | 1,214 | 3,414 | 384 x 2 | ForceWare 267.84 |
| 2x ASUS GeForce GTX 580 in SLI (3,072MB) | £740 | 772 | 1,024 | 1,544 | 4,008 | 384 x 2 | ForceWare 266.58 |
| 2x ASUS GeForce GTX 570 in SLI (2,560MB) | £530 | 732 | 960 | 1,464 | 3,600 | 320 x 2 | ForceWare 266.58 |
| Gigabyte GeForce GTX 580 SOC (1,536MB) | £420 | 855 | 512 | 1,710 | 4,100 | 384 | ForceWare 270.61 |
| Inno3D GeForce GTX 580 HAWK (3,072MB) | £400 | 772 | 512 | 1,544 | 4,008 | 384 | ForceWare 275.33 |
| ASUS GeForce GTX 580 (1,536MB) | £370 | 772 | 512 | 1,544 | 4,008 | 384 | ForceWare 266.58 |
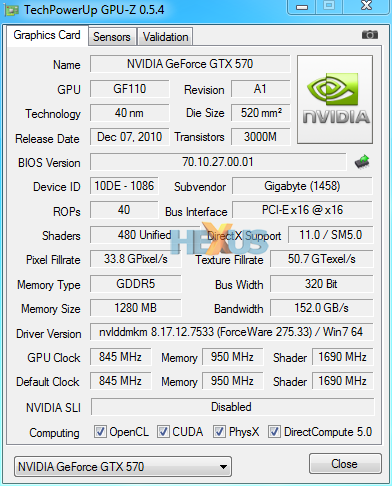
| Gigabyte GeForce GTX 570 SO (1,280MB) | £300 | 845 | 480 | 1,690 | 3,800 | 320 | ForceWare 275.33 |
| ASUS GeForce GTX 570 (1,280MB) | £265 | 732 | 480 | 1,464 | 3,800 | 320 | ForceWare 275.33 |
| Point of View GeForce GTX 560 Ti (1,024MB) | £180 | 822 | 384 | 1,645 | 4,008 | 256 | ForceWare 270.61 |
| Sapphire Radeon HD 6990 OC (4,096MB) | £530 | 880 | 3,072 | 880 | 5,000 | 256 x 2 | Catalyst 11.4 |
| Sapphire Radeon HD 6990 (4,096MB) | £530 | 830 | 3,072 | 830 | 5,000 | 256 x 2 | Catalyst 11.4 |
| 2x HIS Radeon HD 6970 in CrossFire (4,096MB) | £520 | 880 | 3,072 | 880 | 5,500 | 256 x 2 | Catalyst 11.4 |
| 2x Sapphire Radeon HD 6950 in CrossFire (4,096MB) | £400 | 800 | 2,816 | 800 | 5,000 | 256 x 2 | Catalyst 11.4 |
| PowerColor HD 6870 X2 (2,048MB) | £315 | 900 | 2,240 | 900 | 4,200 | 256 x 2 | Catalyst 11.6 |
| HIS Radeon HD 6970 (2,048MB) | £260 | 880 | 1,536 | 880 | 5,500 | 256 | Catalyst 11.4 |
| Sapphire Radeon HD 6950 (2,048MB) | £200 | 800 | 1,408 | 800 | 5,000 | 256 | Catalyst 11.4 |
Test bench |
||||||||||||
|---|---|---|---|---|---|---|---|---|---|---|---|---|
| CPU | Intel Core i7 980X (3.33GHz, 12MB L3 cache, six-core, LGA1366) | |||||||||||
| Motherboard | ASUS P6X58D-E (0502 BIOS) | |||||||||||
| Memory | 6GB Corsair Dominator (9-9-9-24-2T @ 1,600MHz) | |||||||||||
| Power Supply | Corsair HX1000W | |||||||||||
| Monitor | Dell 30in 3007WFP | |||||||||||
| Disk drive(s) | Crucial RealSSD C300 (256GB) | |||||||||||
| Chassis | Corsair Obsidian Series 700D | |||||||||||
| Operating system | Windows 7, SP1, 64-bit | |||||||||||
Benchmarks |
||||||||||||
|---|---|---|---|---|---|---|---|---|---|---|---|---|
| 3DMark 11 | Extreme preset, overall score and combined test results recorded. | |||||||||||
| Aliens vs. Predator | DX11, 1,920x1,080 and 2,560x1,600 resolutions, 4xAA, 16xAF, very high quality. | |||||||||||
| Call of Duty: Black Ops | DX9, 1,920x1,080 and 2,560x1,600 resolutions, 8xAA, ultra quality, FRAPS-recorded benchmark. | |||||||||||
| F1 2010 | DX11, 1,920x1,080 and 2,560x1,600 resolutions, 8xAA, ultra quality, Monaco circuit. | |||||||||||
| Just Cause 2 | DX10, 1,920x1,080 and 2,560x1,600 resolutions, 4xAA, 16xAF, very high quality, Dark Tower benchmark. | |||||||||||
| Metro 2033 | DX11, 1,920x1,080 and 2,560x1,600 resolutions, 4xAA, 16xAF, very high quality. | |||||||||||
| StarCraft II | DX9, 1,920x1,080 and 2,560x1,600 resolutions, 4xAA, ultra quality. | |||||||||||
| Power consumption | To emulate real-world usage scenarios, we record mains power draw both when idle and whilst playing Just Cause 2. | |||||||||||
| Temperature | To emulate real-world usage scenarios, we record GPU core temperature both when idle and whilst playing Just Cause 2. | |||||||||||
| Noise | A PCE-318 noise level meter is placed at front of a Corsair 700D chassis with side panel on. | |||||||||||
Notes
We've thrown the Gigabyte GTX 570 SO in at the deep end. The single card will actually be one of the slowest in the comparison - heck, it's hard to take on a Radeon HD 6990 OC - and the cross-company card to look out for is the Radeon HD 6970.
A standard GeForce GTX 570 has also been re-benchmarked using the same driver-set, ForceWare 275.33, and you'll see that performance, compared to the older 266/270 driver, is up in 3DMark 11 and Just Cause 2.
The review has been updated to include the numbers from the roughly price-equivalent PowerColor Radeon HD 6870 X2 card, whose figures are highlighted in red.


