


Test Methodology
Intel Core i5-9400 Specifications |
|---|
 |
Processor Configurations |
|||||||||||
|---|---|---|---|---|---|---|---|---|---|---|---|
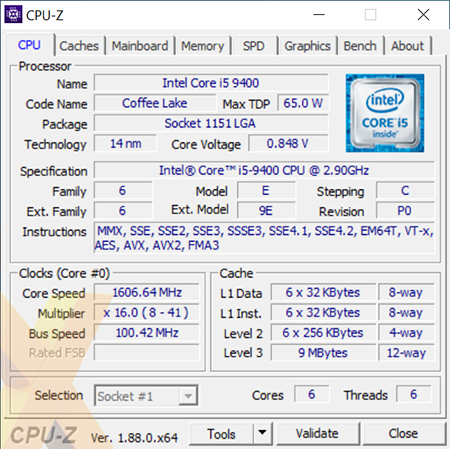
| CPU | Intel Core i5-9400 |
Ryzen 5 2600X |
Ryzen 5 2600 |
||||||||
| CPU Base Clock | 2.9GHz |
3.6GHz |
3.4GHz |
||||||||
| CPU Turbo Clock | 4.1GHz |
4.2GHz |
3.9GHz |
||||||||
| CPU L3 Cache | 9MB |
16MB |
16MB |
||||||||
| CPU Cores / Threads | 6 / 6 |
6 / 12 |
6 / 12 |
||||||||
| CPU TDP | 65W |
95W |
65W |
||||||||
| Integrated Graphics | UHD 630 |
- |
- |
||||||||
| IGP Base Clock | 350MHz |
- |
- |
||||||||
| IGP Turbo Clock | 1,050MHz |
- |
- |
||||||||
| Socket | LGA1151 |
AM4 |
AM4 |
||||||||
| Lithography | 14nm |
12nm |
12nm |
||||||||
| Motherboard | Asus Z390-I Gaming |
MSI X470 Gaming M7 AC |
|||||||||
| BIOS | 2401 |
1.80 |
|||||||||
| Memory | Corsair Vengeance 32GB DDR4 |
||||||||||
| Memory Config | 4x8GB |
||||||||||
| Memory Timings | 16-17-17-36-2T |
||||||||||
| Memory Speed | 2,666MHz |
2,933MHz |
|||||||||
| Disk Drive | SK hynix Canvas SC300 (512GB) |
||||||||||
| Power Supply | be quiet Dark Power Pro 11 (1,000W) |
||||||||||
| Graphics Card | Nvidia GeForce GTX 1080 Ti Founders Edition (425.31) |
||||||||||
| CPU Cooler | Noctua NH-D15S |
||||||||||
| Operating System | Microsoft Windows 10 (64-bit) |
||||||||||
Benchmark Suite |
||||||||||||
|---|---|---|---|---|---|---|---|---|---|---|---|---|
| CPU Benchmarks | ||||||||||||
| HEXUS PiFast | Our number-crunching benchmark stresses a single core by calculating Pi to 10m places | |||||||||||
| Cinebench R20 | Using Cinebench's multi-CPU render, this cross-platform benchmark stresses all cores | |||||||||||
| HandBrake 1.2.2 | Free-to-use video encoder that stresses all CPU cores (64-bit). Updated benchmark - 4K to 1080p60 | |||||||||||
| Blender 2.79b | Using all available cores to run the BMW benchmark | |||||||||||
| PCMark 10 | System-wide test that examines real-world performance | |||||||||||
| Corona 1.3 | Using the high-performance renderer's default benchmark that stresses all cores | |||||||||||
| Memory Benchmarks | ||||||||||||
| AIDA64 v5.99.4900 | Benchmark that analysis memory bandwidth and latency | |||||||||||
| Gaming Benchmarks | ||||||||||||
| 3DMark | Graphics benchmark run using Fire Strike and Time Spy tests | |||||||||||
| 3DMark Port Royal | Ray tracing benchmark that can be run on both RTX and GTX cards | |||||||||||
| F1 2017 | 1,920x1,080 and 3,840x2,160, ultra settings | |||||||||||
| Civilization VI | 1,920x1,080 and 3,840x2,160, 8xMSAA, High Quality | |||||||||||
| World of Tanks | 1,920x1,080 and 3,840x2,160, TSSAA HQ, Ultra Quality | |||||||||||
| Miscellaneous Benchmarks | ||||||||||||
| Power Consumption | To emulate real-world usage scenarios, we record system-wide mains power draw when idle, when rendering via Blender and while playing Civilization VI | |||||||||||
Notes
Appreciating that we have mentioned the rival AMD CPUs, it makes sense to compare the Core i5-9400 to both. All drivers and benchmarks have been updated, plus we're trying a few new ones such as 3DMark Port Royal. It's easy to cross-compare results to other, older processors, which you can do right over here.
You'll notice that there are no ensuing overclocking tests for this chip; the lack of K-suffix means that its multiplier cannot be raised. Therefore, overclocking is largely moot.


