


Testing Methodology
EVGA GeForce GTX 1060 SC Gaming 3GB Specification |
|---|
 |
GPU Comparisons |
|||||||||
|---|---|---|---|---|---|---|---|---|---|
GPU |
Memory |
Miscellaneous |
|||||||
Cores |
Base (MHz) |
Boost (MHz) |
Size (MB) |
Clock (MHz) |
Bus (bits) |
Power Config |
Driver |
||
| Nvidia GeForce GTX 1080 Founders Edition | 2,560 |
1,607 |
1,734 |
8,192 |
10,008 |
256 |
8 |
368.39 |
|
| Nvidia GeForce GTX 1070 Founders Edition | 1,920 |
1,506 |
1,683 |
8,192 |
8,008 |
256 |
8 |
368.39 |
|
| EVGA GeForce GTX 1060 SC Gaming 6GB | 1,280 |
1,607 |
1,835 |
6,144 |
8,008 |
192 |
6 |
368.81 |
|
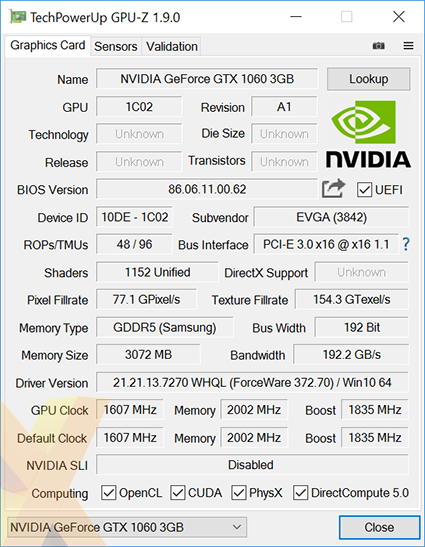
| EVGA GeForce GTX 1060 SC Gaming 3GB | 1,152 |
1,607 |
1,835 |
3,072 |
8,008 |
192 |
6 |
372.70 |
|
| MSI GeForce GTX 980 Gaming | 2,048 |
1,216 |
1,317 |
4,096 |
7,012 |
256 |
8+8 |
368.64 |
|
| Gigabyte GeForce GTX 970 Mini ITX OC | 1,664 |
1,076 |
1,216 |
4,096 |
7,012 |
256 |
8 |
368.81 |
|
| Asus GeForce GTX 960 Direct CU II | 1,024 |
1,253 |
1,317 |
2,048 |
7,200 |
128 |
6 |
368.39 |
|
| Sapphire Radeon RX 480 Nitro OC 8GB | 2,304 |
1,208 |
1,342 |
8,192 |
8,000 |
256 |
8 |
16.7.3 |
|
| Sapphire Radeon RX 480 Nitro 4GB | 2,304 |
1,208 |
1,306 |
4,096 |
7,000 |
256 |
8 |
16.7.3 |
|
| Asus Radeon RX 470 Strix OC | 2,048 |
- |
1,250 |
4,096 |
6,600 |
256 |
8 |
16.7.3 |
|
| Sapphire Radeon R9 Fury X | 4,096 |
- |
1,050 |
4,096 |
1,000 |
4,096 |
8+8 |
16.7.3 |
|
| Sapphire Radeon R9 390 Nitro | 2,560 |
- |
1,010 |
8,192 |
6,000 |
512 |
8+8 |
16.7.3 |
MSI Radeon R9 270X Gaming 2G ITX | 1,280 |
- |
1,080 |
2,048 |
5,600 |
256 |
8 |
16.7.3 |
HEXUS Graphics Test Bench |
||
|---|---|---|
| Hardware Components | Product Page | |
| Processor | Intel Core i7-6700K (overclocked to 4.4GHz) | intel.com |
| CPU Cooler | Noctua NH-D15S | noctua.at |
| Motherboard | Asus Z170 Pro | asus.com |
| Memory | Crucial Ballistix Sport LT 32GB (2x16GB) DDR4-2400 | crucial.com |
| Power Supply | be quiet! Dark Power Pro 11 850W | bequiet.com |
| Primary Storage | 256GB Samsung 950 Pro | samsung.com |
| Secondary Storage | 512GB SK hynix Canvas SC300 | skhynix.com |
| Chassis | Fractal Design Define R5 Windowed | fractal-design.com |
| Monitor | Philips Brilliance 4K Ultra HD LED (288P6LJEB/00) | philips.co.uk |
| Operating system | Windows 10 (64-bit) | microsoft.com |
Benchmark Suite |
|
|---|---|
| Synthetic Benchmarks | |
| 3DMark | Fire Strike, Fire Strike Extreme, Fire Strike Ultra, Time Spy and Time Spy Stability Tests |
| Gaming Benchmarks and Settings | |
| Dirt Rally | DX11, 4xMSAA, Ultra Quality |
| Doom | Vulkan, TSSAA (8TX), Ultra Quality |
| Fallout 4 | DX11, TAA, Ultra Quality |
| Rise of the Tomb Raider | DX12, FXAA, Very High Quality |
| Tom Clancy's The Division | DX11, FXAA, Ultra Quality |
| Total War: Warhammer | DX12, MLAA, Ultra Quality |
| General Benchmarks | |
| Power Consumption | To emulate real-world usage scenarios, we record system-wide mains power draw both when idle and while playing Dirt Rally. |
| Temperature | To emulate real-world usage scenarios, we record GPU core temperature both when idle and while playing Dirt Rally. |
| Noise | A PCE-318 meter is used to record noise levels when idle and while playing Dirt Rally. |
| Overclocking | Maintaining out-the-box voltage, we increase the card's power target and aim for an optimal balance of core and memory overclock. With the heightened frequencies in place, the 3DMark, Dirt Rally and Rise of the Tomb Raider tests are re-run at 4K UHD settings. |
Notes
To minimise the impact of any CPU bottlenecks, our test platform is configured with a quad-core Intel Core i7-6700K processor overclocked to 4.4GHz across all cores and 32GB of Crucial Ballistix Sport LT DDR4 memory set to run at 2,400MHz using the built-in XMP profile.
For our high-end benchmark suite, we have an array of games tested at FHD (1,920x1,080), QHD (2,560x1,440) and 4K UHD (3,840x2,160) resolutions. Where applicable, any vendor-specific enhancements such as PhysX and TressFX are disabled to help even the playing field. In-game benchmark results are recorded as minimum and average frames per second.
The key comparisons are the Sapphire RX 480 duo, particularly the 4GB variant priced at the same levels, and the RX 470 that's a tad cheaper.


