


Performance
We test performance a number of ways, firstly in terms of resolution scaling.Resolution Scaling
Resolution scaling, to check various things like whether we're geometry bound, or basic fillrate bound, we simply run the basic, default test at three resolutions. Futuremark claim there's little difference between resolutions, due to fillrate demands placed on the card, by the use of the big shadow maps, so we check that out.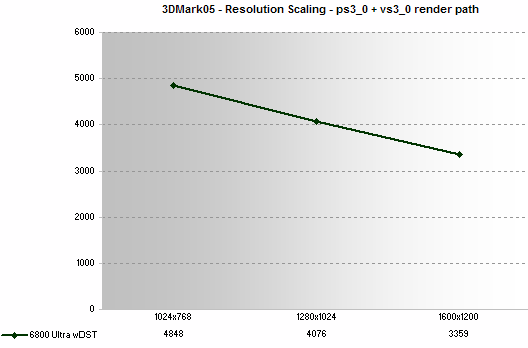
On the 256MB card, you drop about 15% when moving to 1280x1204, then only a further 17% when increasing the resolution to 1600x1200.
IQ Performance Scaling
To futher analyse 3DMark05's performance attributes, we also test at differing IQ settings, at a couple of resolutions, to see how it scales with IQ settings.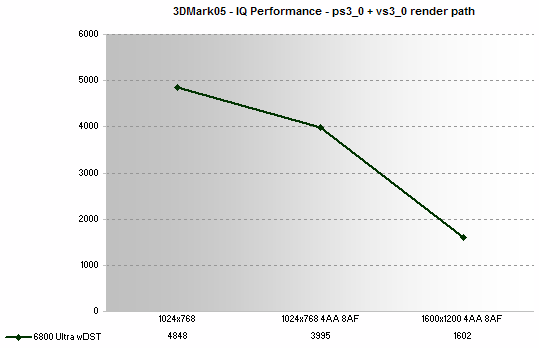
Fillrate hit caused by the shadow maps is constant across resolutions. They use the same size maps regardless of the size of the screen they're rendering to, for each light source. Turning on IQ settings however increases that fillrate load due to the use of anti-aliasing buffers in memory and the anisotropic filtering sample results packed in there too. So even if the shadow map fillrate load is constant across all resolutions, we can still add to that load, dropping performance further, by turning on IQ settings.
At 1280x1024, with 4AA and 8AF we get 3224 marks (not shown on the graphs). So, the move to 1280x1024 with no IQ gets us a 15% drop, and adding IQ to things at 1024 gets us 18% less performance. Combined, from 1024x768 with no IQ settings, to 1280x1024 with IQ settings, we drop around 35% in performance.
That performance falls off sharper at 1600x1200 with 4X AA and 8X AF applied indicates that at least initially and at the median setting, it's not just the fillrate load that limits performance. Let's examine it another way to try and get a further handle on things.
Bus Scaling
To test bus scaling, to see if 05 is system limited in any way, I drop multipler to 15X and bump up the front side bus speed of the host CPU to 226MHz, from 200MHz, giving a 13% boost in memory bandwidth at the same basic clock speed (3400MHz).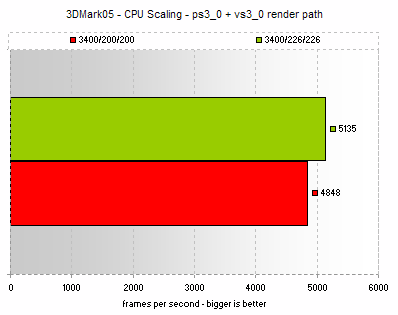
For the memory bandwidth increase of 13%, we get 6% increase in overall performance. Transfer of data from system memory is another factor in performance, but it's unclear as to why, to me at least, at the time of writing.
Shader Model performance
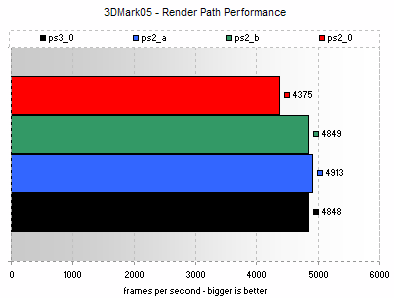
Here we can see that although the ps2_0 path is a limiting factor in performance, since GeForce 6-series is optimised for fragment programs that exceed the specification set out for instruction count etc in ps2_0, it's pretty much happy doing rendering at the other three profile settings. Shader Model 3.0 isn't a win on GeForce 6800, but neither is it a loss.


