


Introduction, System Setup
The Nvidia GeForce GTX Titan X duly took single-GPU graphics performance to another level when launched last week. Outfitted with an 8-billion transistor die consisting of 3,072 cores based on the energy efficient Maxwell architecture - big numbers everywhere - Titan X is the first card to offer relatively smooth performance at a lusty 4K resolution.
Equipped with 12GB of RAM and having no performance peer until the AMD Radeon R9 390X makes its much-awaited bow in the next few months, £870 is the steep asking price for turning all the eye candy on.
There's no real need to house the 10.5in-long card in a huge box, either. ASRock is busy readying a mini-ITX version of the powerful X99 chipset, so, potentially, you could have an Intel Core i7-5960X eight-core processor and Titan X card in a pint-sized chassis.
The standard 250W TDP of Titan X and SLI compatibility does offer up the chance to see how much more performance is available when a second card is added to the system. Designed to boost 4K gaming performance to another level - Nvidia should be targeting 4K60 at a minimum - it's worth investigating if the large-die Maxwell GPU continues to scale well. To this end we've got ourselves a second reference Titan X GPU, lashed the two together via SLI, and chuckled at some of the numbers produced at lower resolutions.
Without further ado, let's get onto them there benchmarks.
GPU Comparisons |
||||||||
|---|---|---|---|---|---|---|---|---|
| Graphics Card | GPU Cores | Base Clock (MHz) |
Boost Clock (MHz) |
Memory Size (MB) |
Memory Clock (MHz) |
Memory Bus (bits) |
Graphics Driver | |
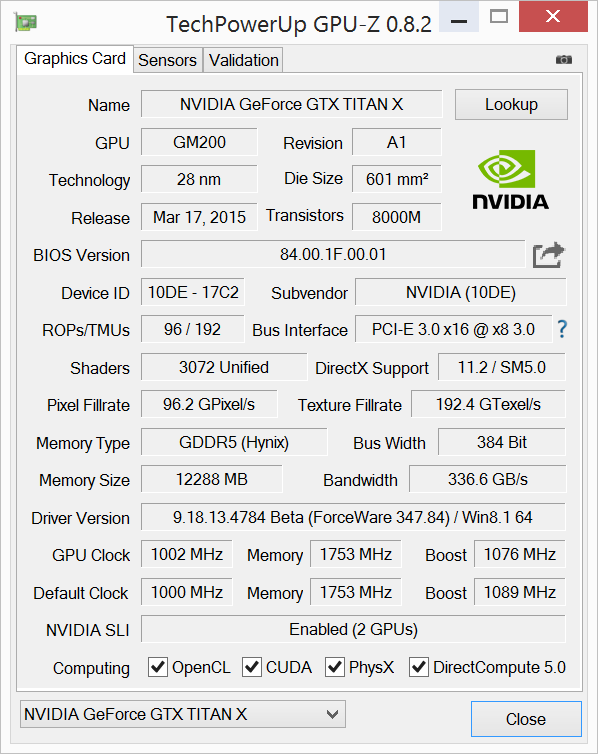
| Nvidia GeForce GTX Titan X SLI (12GB) | 3,072 x2 | 1,002 | 1,076 | 12,288 x2 | 7,012 | 384 x2 | 347.84 | |
| Nvidia GeForce GTX Titan X (12GB) | 3,072 | 1,002 | 1,076 | 12,288 | 7,012 | 384 | 347.84 | |
| Nvidia GeForce GTX 980 (4GB) | 2,048 | 1,127 | 1,216 | 4,096 | 7,012 | 256 | 347.84 | |
| Nvidia GeForce GTX Titan (6GB) | 2,688 | 837 | 876 | 6,144 | 6,008 | 384 | 347.84 | |
| AMD Radeon R9 295X2 (8GB) | 2,816 x2 | N/A | 1,018 | 4,096 | 5,000 | 512 x2 | 15.3 beta | |
| AMD Radeon R9 290X (4GB) | 2,816 | N/A | 1,000 | 4,096 | 5,000 | 512 | 15.3 beta | |
| AMD Radeon R9 290 (4GB) | 2,560 | N/A | 947 | 4,096 | 5,000 | 512 | 15.3 beta | |
HEXUS Graphics Test Bench |
|||
|---|---|---|---|
| Hardware Components | HEXUS Review | Product Page | |
| Processor | Intel Core i7-4770K (quad-core, overclocked up to 4.40GHz) | June 2013 | Intel.com |
| CPU Cooler | Noctua NH-D15 | April 2014 | Noctua.at |
| Motherboard | Asus Z97-A | May 2014 | Asus.co.uk |
| Memory | 16GB Corsair Vengeance Pro (2x8GB) DDR3 @ 1,866MHz | - | Corsair.com |
| Power Supply | Corsair AX760i | - | Corsair.com |
| Storage Device | Crucial M500 240GB SSD | July 2013 | Crucial.com |
| Chassis | Corsair Graphite Series 600T | October 2010 | Corsair.com |
| Monitor | Philips Brilliance 4K Ultra HD LED (288P6LJEB/00) | - | Philips.co.uk |
| Operating system | Windows 8.1 (64-bit) | October 2012 | Microsoft.com |
Benchmark Suite |
|||
|---|---|---|---|
| Synthetic Benchmarks | |||
| 3DMark | Fire Strike, Fire Strike Extreme and Fire Strike Ultra | ||
| Gaming Benchmarks | |||
| Title | Settings at 1,920x1,080 (FHD) |
Settings at 2,560x1,440 (QHD) |
Settings at 3,840x2,160 (4K UHD) |
| Alien: Isolation | SMAA-T2x, Maximum Quality | SMAA-T2x, Maximum Quality | FXAA, Maximum Quality |
| BioShock Infinite | AA Enabled, Ultra Preset inc. Depth of Field | AA Enabled, Ultra Preset inc. Depth of Field | AA Enabled, Ultra Preset inc. Depth of Field |
| Grid Autosport | 8xMSAA, Maximum Quality Settings (Soft Ambient Occlusion On, Advanced Lighting On, Global Illumination On) | 4xMSAA, Maximum Quality Settings (Soft Ambient Occlusion On, Advanced Lighting On, Global Illumination On) | 4xMSAA, Maximum Quality Settings (Soft Ambient Occlusion On, Advanced Lighting On, Global Illumination On) |
| Middle-earth: Shadow of Mordor | Ultra Quality Preset | Ultra Quality Preset | Very High Quality Preset |
| Tomb Raider | FXAA, Ultra Quality Preset, TressFX Disabled | FXAA, Ultra Quality Preset, TressFX Disabled | FXAA, Ultra Quality Preset, TressFX Disabled |
| Total War: Rome II | Ultra Preset | Ultra Preset | Ultra Preset |
| General Benchmarks | |||
| Power Consumption | To emulate real-world usage scenarios, we record system-wide mains power draw both when idle and while playing Grid Autosport. | ||
| Temperature | To emulate real-world usage scenarios, we record GPU core temperature both when idle and while playing Grid Autosport. | ||
| Noise | A PCE-318 meter is used to record noise levels when idle and while playing Grid Autosport. | ||
| Overclocking | Maintaining out-the-box voltage, we increase the card's power target and aim for an optimal balance of core and memory overclock. With the heightened frequencies in place, the 3DMark and Total War: Rome II tests are re-run. | ||
Notes
All cards have been benchmarked from scratch using the latest drivers at the time of testing.
To minimise the impact of any CPU bottlenecks, our test platform is configured with a quad-core Intel Core i7-4770K overclocked up to 4.4GHz. 16GB of Corsair Vengeance Pro DDR3 is set to run at 1,866MHz using the built-in XMP profile.
For our ultra-high-end benchmark suite, we have an array of games tested at full-HD (1,920x1,080) QHD (2,560x1,440) and 4K (3,840x2,160) resolutions. In order to maintain playable framerates in the latter mode, the level of anti-aliasing may be reduced and any such changes are highlighted using bold in the above table. Readers should note that, despite running with lowered settings, games often look considerably better at 4K as a result of the huge increase in on-screen pixels.
Where applicable, any vendor-specific enhancements such as PhysX and TressFX are disabled to help even the playing field.
In-game benchmark results are recorded as average frames per second, and to provide further analysis, we report the percentage of frames rendered within a specified time, as well as the time taken to render the slowest one per cent of frames during the benchmark run. We choose 25ms at 4K which equates to a full 40 frames over a second. This number is chosen for two reasons: it's the lowest we reckon is passable for smooth gameplay and, secondly, is where refresh-rate-adjusting technologies such as G-Sync and FreeSync begin to have a real frame-smoothing impact.


