


Test methodology
On paper, the core specification of Gigabyte's GeForce GTX 460 SOC suggests that performance is going to be practically identical to the recently-reviewed KFA2 GeForce GTX 460 LTD OC - the two cards are separated by a mere 5MHz.
But there's more to the benchmarks than speed alone. The Gigabyte card currently costs £15 less and should perform well in our temperature and noise tests.
More importantly, the fiercely-contested mid-range space has recently been infiltrated by AMD's Radeon HD 6850 and 6870 - both of which offer performance and features in spades for just £150 and £195, respectively.
You'll no doubt want to see how they all compare, so we've a total of 14 GPUs included in today's roundup. The details of each - along with descriptions of our test suite and benchmarks - can be found below.
GPU comparisons |
|||||||
|---|---|---|---|---|---|---|---|
| Graphics cards | Approx. pricing | GPU clock (MHz) | Stream processors | Shader clock (MHz) | Memory clock (MHz) | Memory bus (bits) | Graphics driver |
| ASUS GeForce GTX 480 1,536MB | £350 | 700 | 480 | 1,401 | 3,698 | 384 | ForceWare 260.89 |
| ASUS GeForce GTX 470 1,280MB | £200 | 607 | 448 | 1,215 | 3,348 | 320 | ForceWare 260.89 |
| ASUS GeForce GTX 465 1,024MB | £170 | 607 | 352 | 1,215 | 3,206 | 256 | ForceWare 260.89 |
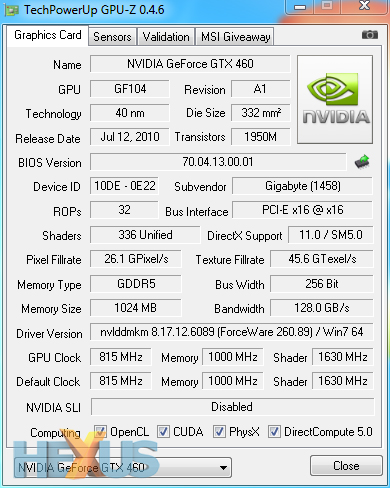
| Gigabyte GeForce GTX 460 SOC 1,024MB | £175 | 815 | 336 | 1,630 | 4,000 | 256 | ForceWare 260.89 |
| KFA2
GeForce GTX 460 LTD OC 1,024MB |
£190 | 810 | 336 | 1,620 | 4,000 | 256 | ForceWare 260.89 |
| EVGA
GeForce GTX 460 1,024MB |
£155 | 675 | 336 | 1,350 | 3,600 | 256 | ForceWare 260.89 |
| POV GeForce GTX 460 TGT UC 768MB | £170 | 824 | 336 | 1,648 | 4,020 | 192 | ForceWare 260.89 |
| EVGA GeForce GTX 460 768MB | £135 | 675 | 336 | 1,350 | 3,600 | 192 | ForceWare 260.89 |
| Sapphire Radeon HD 5870 1,024MB | £275 | 850 | 1,600 | 850 | 4,800 | 256 | Catalyst 10.10P |
| HIS Radeon HD 5850 1,024MB | £210 | 725 | 1,440 | 725 | 4,000 | 256 | Catalyst 10.10P |
| HIS Radeon HD 6870 1,024MB | £195 | 900 | 1,120 | 900 | 4,200 | 256 | Catalyst 10.10P |
| Sapphire Radeon HD 6850 1,024MB | £150 | 775 | 960 | 775 | 4,000 | 256 | Catalyst 10.10P |
| Sapphire Radeon HD 5830 1,024MB | £165 | 800 | 1,120 | 800 | 4,000 | 256 | Catalyst 10.10P |
| HIS Radeon HD 5770 1,024MB | £110 | 850 | 800 | 850 | 4,800 | 128 | Catalyst 10.10P |
Test bench |
||||||||||||
|---|---|---|---|---|---|---|---|---|---|---|---|---|
| CPU | Intel Core i7 980X Extreme Edition (3.33GHz, 12MB L3 cache, hexa-core, LGA1366 - Turbo Boost enabled) | |||||||||||
| Motherboard | ASUS P6X58D Premium | |||||||||||
| Motherboard BIOS | 1002 | |||||||||||
| Memory | 6GB Corsair DDR3 | |||||||||||
| Memory timings and speed | 9-9-9-24-1T @ DDR3-1,600 | |||||||||||
| PSU | Corsair HX1000W | |||||||||||
| Monitor | Dell 30in 3007WFP - 2,560x1,600px | |||||||||||
| Disk drive(s) | Corsair Force F80 SSD | |||||||||||
| Operating system | Windows 7 Ultimate, 64-bit | |||||||||||
Benchmarks |
||||||||||||
|---|---|---|---|---|---|---|---|---|---|---|---|---|
| 3DMark Vantage | DX10, Run at the 'high' preset and overall, GPU and Feature Test 4 scores noted | |||||||||||
| Unigine Heaven | DX11, 1,920x1,080, various tessellation modes | |||||||||||
| Aliens vs. Predator | DX11, 1,680x1,050, 1,920x1,080 and 2,560x1,600 resolutions, 2xAA, 16xAF, very high quality. | |||||||||||
| Call of Duty: Modern Warfare 2 | DX9, 1,680x1,050, 1,920x1,080 and 2,560x1,600 resolutions, 4xAA, ultra quality, FRAPS-recorded benchmark. | |||||||||||
| Just Cause 2 | DX10, 1,680x1,050, 1,920x1,080 and 2,560x1,600 resolutions, 4xAA, 16xAF, Dark Tower benchmark | |||||||||||
| Mafia II | DX9, 1,680x1,050, 1,920x1,080 and 2,560x1,600 resolutions, AA on, 16x AF, built-in benchmark | |||||||||||
| Temperature | To emulate real-world usage scenarios, we record GPU core temperature both when idle and whilst playing Call of Duty: MW2. And, for a worst-case scenario, we throw in numbers from the FurMark stress test. | |||||||||||
| Power consumption | To emulate real-world usage scenarios, we record mains power draw both when idle and whilst playing Call of Duty: MW2. And, for a worst-case scenario, we throw in numbers from the FurMark stress test. | |||||||||||
| Noise | Albeit not scientific, we use the tried-and-trusted human ear to share an opinion on GPU noise. | |||||||||||


