


Test Methodology
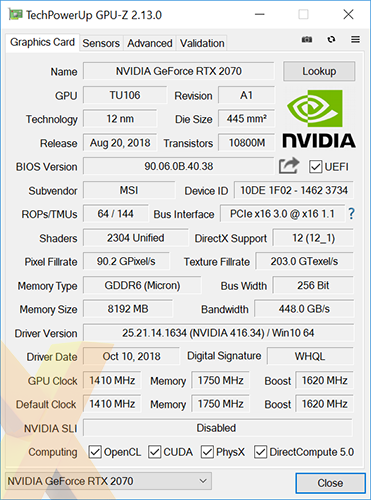
MSI GeForce RTX 2070 Armor 8G |
|---|
 |
GPU Comparisons |
||||||||||
|---|---|---|---|---|---|---|---|---|---|---|
GPU |
Memory |
Miscellaneous |
||||||||
Cores |
Base (MHz) |
Boost (MHz) |
Type |
Size (MB) |
Clock (MHz) |
Bus (bits) |
Power Config |
Driver |
||
| MSI GeForce RTX 2080 Ti Duke 11G OC | 4,352 |
1,350 |
1,665 |
GDDR6 |
11,264 |
14,000 |
352 |
8+8 |
411.63 |
|
| Nvidia GeForce RTX 2080 Ti Founders Edition | 4,352 |
1,350 |
1,635 |
GDDR6 |
11,264 |
14,000 |
352 |
8+8 |
411.51 |
|
| Gigabyte GeForce RTX 2080 Gaming OC | 2,944 |
1,515 |
1,815 |
GDDR6 |
8,192 |
14,000 |
256 |
6+8 |
411.63 |
|
| Nvidia GeForce RTX 2080 Founders Edition | 2,944 |
1,515 |
1,800 |
GDDR6 |
8,192 |
14,000 |
256 |
6+8 |
411.51 |
|
| EVGA GeForce RTX 2070 XC Ultra Gaming | 2,304 |
1,410 |
1,725 |
GDDR6 |
8,192 |
14,000 |
256 |
6+8 |
416.34 |
|
| MSI GeForce RTX 2070 Armor 8G | 2,304 |
1,410 |
1,620 |
GDDR6 |
8,192 |
14,000 |
256 |
6+8 |
416.34 |
|
| Palit GeForce RTX 2070 Dual | 2,304 |
1,410 |
1,620 |
GDDR6 |
8,192 |
14,000 |
256 |
6+8 |
416.33 |
|
| MSI GeForce GTX 1080 Ti Gaming X Trio | 3,584 |
1,544 |
1,658 |
GDDR5X |
11,264 |
11,008 |
352 |
8+8 |
411.63 |
|
| Nvidia GeForce GTX 1080 Ti Founders Edition | 3,584 |
1,481 |
1,582 |
GDDR5X |
11,264 |
11,008 |
352 |
6+8 |
399.27 |
|
| Nvidia GeForce GTX 1080 Founders Edition | 2,560 |
1,607 |
1,734 |
GDDR5 |
8,192 |
10,008 |
256 |
8 |
399.27 |
|
| EVGA GeForce GTX 1070 FTW | 1,920 |
1,607 |
1,797 |
GDDR5 |
8,192 |
8,008 |
256 |
8+8 |
416.34 |
|
| Nvidia GeForce GTX 1060 Founders Edition | 1,280 |
1,506 |
1,683 |
GDDR5 |
6,144 |
8,008 |
192 |
6 |
399.27 |
|
| AMD Radeon RX Vega 64 | 4,096 |
1,247 |
1,546 |
HBM2 |
8,192 |
945 |
2,048 |
8+8 |
18.8.2 |
|
| AMD Radeon RX Vega 56 | 3,584 |
1,156 |
1,471 |
HBM2 |
8,192 |
800 |
2,048 |
8+8 |
18.8.2 |
|
| AMD Radeon RX 580 | 2,304 |
- |
1,450 |
GDDR5 |
8,192 |
8,000 |
256 |
6+8 |
18.8.2 |
|
HEXUS Graphics Test Bench |
||
|---|---|---|
| Hardware Components | Product Page | |
| Processor | Intel Core i7-8700K (overclocked to 4.8GHz) | intel.com |
| CPU Cooler | Fractal Design Celsius S24 | fractal-design.com |
| Motherboard | Asus ROG Maximus X Hero | asus.com |
| Memory | G.Skill Trident Z 32GB (2x16GB) DDR4-3200 | gskill.com |
| Power Supply | be quiet! Dark Power Pro 11 1,000W | bequiet.com |
| Primary Storage | 256GB WD Black PCIe SSD | wdc.com |
| Secondary Storage | 1TB Crucial MX300 SATA SSD | crucial.com |
| Chassis | be quiet! Dark Base 700 | bequiet.com |
| Monitor | iiyama ProLite X4071UHSU-B1 | iiyama.com |
| Operating system | Windows 10 Pro | microsoft.com |
Benchmark Suite |
||
|---|---|---|
| Synthetic Benchmarks | ||
| 3DMark | Time Spy, Time Spy Extreme, Time Spy Stress Test | |
| Gaming Benchmarks and Settings | ||
| Civilization VI | DX12, 8xMSAA, High Quality | |
| Far Cry 5 | DX11, TAA, Ultra Quality | |
| Forza Motorsport 7 | DX12, 4xMSAA, Ultra Quality | |
| Gears of War 4 | DX12, TAA, Ultra Quality | |
| Middle-earth: Shadow of War | DX11, TAA, Ultra Quality | |
| Shadow of the Tomb Raider | DX12, TAA, Highest Quality | |
| Total War: Warhammer II | DX12, FXAA, Ultra Quality | |
| World of Tanks enCore | DX11, TSSAA HQ, Ultra Quality | |
| General Benchmarks | ||
| Power Consumption | To emulate real-world usage scenarios, we record system-wide mains power draw both when idle and while playing Gears of War 4 | |
| Temperature | To emulate real-world usage scenarios, we record GPU core temperature both when idle and while playing Gears of War 4 | |
| Noise | A PCE-318 meter is used to record noise levels when idle and while playing Gears of War 4 | |
| Overclocking | Maintaining out-the-box voltage, we use the Precision X1 Scanner Tool to determine an optimal frequency curve while applying a manual memory overclock | |


