


Testing Methodology
Intel Core i5-6600K Specification |
|---|
 |
Comparison Processor Configurations |
|||||||||
|---|---|---|---|---|---|---|---|---|---|
| CPU | Intel |
AMD |
|||||||
Core i7-6700K |
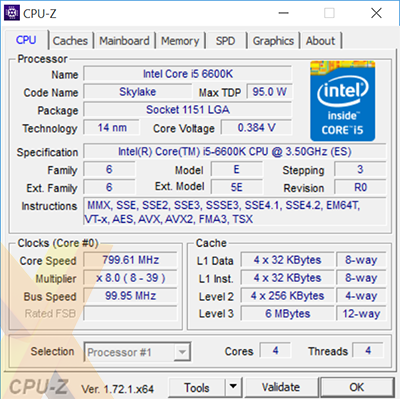
Core i5-6600K |
Core i7-5775C |
Core i7-4790K |
Core i5-4690K |
Core i7-3770K |
Core i7-2700K |
A10-7870K |
A10-7850K |
|
| CPU Base Clock | 4.0GHz |
3.5GHz |
3.3GHz |
4.0GHz |
3.5GHz |
3.5GHz |
3.5GHz |
3.9GHz |
3.7GHz |
| CPU Turbo Clock | 4.2GHz |
3.9GHz |
3.7GHz |
4.4GHz |
3.9GHz |
3.9GHz |
3.9GHz |
4.1GHz |
4.0GHz |
| CPU Cache | 8MB |
6MB |
6MB |
8MB |
8MB |
8MB |
8MB |
4MB |
4MB |
| CPU Cores / Threads | 4 / 8 |
4 / 4 |
4 / 8 |
4 / 8 |
4 / 4 |
4 / 8 |
4 / 8 |
4 / 4 |
4 / 4 |
| CPU TDP | 91W |
91W |
65W |
88W |
88W |
77W |
95W |
95W |
95W |
| Integrated Graphics | HD 530 |
HD 530 |
Iris Pro 6200 |
HD 4600 |
HD 4600 |
HD 4000 |
HD 3000 |
Radeon R7 |
Radeon R7 |
| IGP Base Clock | 300MHz |
300MHz |
300MHz |
350MHz |
350MHz |
650MHz |
850MHz |
866MHz |
720MHz |
| IGP Turbo Clock | 1.15GHz |
1.15GHz |
1.15GHz |
1.25GHz |
1.20GHz |
1.15GHz |
1.35GHz |
- |
- |
| Socket | LGA 1151 |
LGA 1151 |
LGA 1150 |
LGA 1150 |
LGA 1150 |
LGA 1155 |
LGA 1155 |
FM2+ |
FM2+ |
| Lithography | 14nm |
14nm |
14nm |
22nm |
22nm |
22nm |
32nm |
28nm |
28nm |
| Motherboard | Asus Z170-K |
Asus Z97-A |
Asus P8Z77-V |
Gigabyte G1-Sniper-A88X |
|||||
| BIOS | 0323 |
2401 |
2104 |
F10 |
|||||
| Memory | Corsair Vengeance LPX 8GB DDR4 (2x4GB) |
Corsair Vengeance 16GB DDR3 (2x8GB) |
|||||||
| Memory Timings | 15-15-15-36-2T @ 2,133MHz |
9-10-9-27-2T @ 1,866MHz |
11-12-11-31-2T @ 2,133MHz |
||||||
| Disk Drive | SK hynix Canvas SC300 (512GB) |
||||||||
| Power Supply | Corsair AX760i (760W) |
||||||||
| CPU Cooler | Noctua NH-D15 |
||||||||
| Operating System | Microsoft Windows 10 (64-bit) |
||||||||
Benchmark Suite |
||||||||||||
|---|---|---|---|---|---|---|---|---|---|---|---|---|
| CPU Benchmarks | ||||||||||||
| HEXUS PiFast | Our number-crunching benchmark stresses a single core by calculating Pi to 10m places | |||||||||||
| Cinebench R15 | Using Cinebench's multi-CPU render, this cross-platform benchmark stresses all cores | |||||||||||
| wPrime 2.1.0 | Another number-crunching benchmark that stresses all available CPU cores/threads | |||||||||||
| Memory Benchmarks | ||||||||||||
| AIDA64 v5.30.3500 | Benchmark that analyses memory bandwidth and latency | |||||||||||
| Multimedia Benchmarks | ||||||||||||
| HandBrake 0.10.2 | Free-to-use video encoder that stresses all CPU cores (64-bit) | |||||||||||
| PCMark 8 v2.4.304 | System-wide examination run using Creative preset with OpenCL acceleration | |||||||||||
| 3DMark v1.5.915 | Graphics test run using the popular Fire Strike preset | |||||||||||
| IGP Benchmarks | ||||||||||||
| Grand Theft Auto V | 1,920x1,080, normal quality | |||||||||||
| Middle-earth: Shadow of Mordor | 1,920x1,080, low quality preset | |||||||||||
| Total War: Rome II | 1,920x1,080, medium quality preset | |||||||||||
| Discrete Gaming Benchmarks (GeForce GTX 980) | ||||||||||||
| Grand Theft Auto V | 1,920x1,080 and 3,840x2,160, FXAA, 16xAF, Very High Quality | |||||||||||
| Middle-earth: Shadow of Mordor | 1,920x1,080 and 3,840x2,160, Ultra Quality Preset | |||||||||||
| Total War: Rome II | 1,920x1,080 and 3,840x2,160, Extreme Preset | |||||||||||
| Miscellaneous Benchmarks | ||||||||||||
| Power Consumption | To emulate real-world usage scenarios, we record system-wide mains power draw when idle, when encoding video via HandBrake and while playing Middle-earth: Shadow of Mordor | |||||||||||


