


Test Methodology
Intel Core i7-8086K Specification |
|---|
 |
Intel Core Processor Configurations |
||||||
|---|---|---|---|---|---|---|
| CPU | Core i7-8086K |
Core i7-8700K |
Core i5-8400 |
Core i3-8100 |
Core i7-6700K |
|
| CPU Base Clock | 4.0GHz |
3.7GHz |
2.8GHz |
3.6GHz |
4.0GHz |
|
| CPU Turbo Clock | 5.0GHz |
4.7GHz |
4.0GHz |
- |
4.2GHz |
|
| CPU Cache | 12MB |
12MB |
9MB |
6MB |
8MB |
|
| CPU Cores / Threads | 6 / 12 |
6 / 12 |
6 / 6 |
4 / 4 |
4 / 8 |
|
| CPU TDP | 95W |
95W |
65W |
65W |
91W |
|
| Integrated Graphics | UHD 630 |
UHD 630 |
UHD 630 |
UHD 630 |
HD530 |
|
| IGP Base Clock | 350MHz |
350MHz |
350MHz |
350MHz |
350MHz |
|
| IGP Turbo Clock | 1,200MHz |
1,200MHz |
1,050MHz |
1,100MHz |
1,150MHz |
|
| Socket | LGA 1151 v2 |
LGA 1151 v1 |
||||
| Lithography | 14nm |
|||||
| Motherboard | Asus Maximus X Hero |
Gigabyte Z170XP-SLI |
||||
| BIOS | 1101 |
F22f |
||||
| Memory | Corsair Vengeance 32GB DDR4 |
|||||
| Memory Config | 4x8GB |
|||||
| Memory Timings | 16-18-18-38-1T |
|||||
| Memory Speed | 2,666MHz
|
2,400MHz |
||||
| Disk Drive | SK hynix Canvas SC300 (512GB) |
|||||
| Power Supply | be quiet Dark Power Pro 11 (1,000W) |
|||||
| Graphics Card | Nvidia GeForce GTX 1080 Ti (391.25) |
|||||
| CPU Cooler | Fractal Celsius S24 |
Noctua NH-D15S |
||||
| Operating System | Microsoft Windows 10 (64-bit) |
|||||
AMD Ryzen Processor Configurations |
|||||||||
|---|---|---|---|---|---|---|---|---|---|
| CPU | Ryzen 7 2700X |
Ryzen 7 2700 |
Ryzen 7 1800X |
Ryzen 5 2600X |
Ryzen 5 2600 |
Ryzen 5 1600X |
|||
| CPU Base Clock | 3.7GHz |
3.2GHz |
3.6GHz |
3.7GHz |
3.4GHz |
3.6GHz |
|||
| CPU Turbo Clock | 4.3GHz |
4.1GHz |
4.0GHz |
4.2GHz |
3.9GHz |
4.0GHz |
|||
| CPU L3 Cache | 16MB |
16MB |
16MB |
16MB |
16MB |
16MB |
|||
| CPU Cores / Threads | 8 / 16 |
8 / 16 |
8 / 16 |
6 / 12 |
6 / 12 |
6 / 12 |
|||
| CPU TDP | 105W |
65W |
95W |
95W |
65W |
95W |
|||
| Integrated Graphics | - |
- |
- |
- |
- |
- |
|||
| Shaders | - |
- |
- |
- |
- |
- |
|||
| IGP Turbo Clock | - |
- |
- |
- |
- |
- |
|||
| Socket | AM4 |
AM4 |
AM4 |
AM4 |
AM4 |
AM4 |
|||
| Lithography | 12nm |
12nm |
14nm |
12nm |
12nm |
14nm |
|||
| Motherboard | Aorus X470 Gaming WiFi 7 |
||||||||
| BIOS | T2b |
||||||||
| Memory | Corsair Vengeance 32GB DDR4 |
||||||||
| Memory Config | 4x8GB |
||||||||
| Memory Timings | 16-18-18-38-1T |
||||||||
| Memory Speed | 2,933MHz |
2,666MHz |
2,933MHz |
2,666MHz |
|||||
| Disk Drive | SK hynix Canvas SC300 (512GB) |
||||||||
| Power Supply | be quiet Dark Power Pro 11 (1,000W) |
||||||||
| Graphics Card | Nvidia GeForce GTX 1080 Ti (391.25) |
||||||||
| CPU Cooler | Noctua NH-D15S |
||||||||
| Operating System | Microsoft Windows 10 (64-bit) |
||||||||
Benchmark Suite |
||||||||||||
|---|---|---|---|---|---|---|---|---|---|---|---|---|
| CPU Benchmarks | ||||||||||||
| HEXUS PiFast | Our number-crunching benchmark stresses a single core by calculating Pi to 10m places | |||||||||||
| Blender 2.79c | Using all available cores, we run the BMW CPU_Blend benchmark | |||||||||||
| Cinebench | Using Cinebench's multi-CPU render, this cross-platform benchmark stresses all cores | |||||||||||
| HandBrake 1.1.0 | Free-to-use video encoder that stresses all CPU cores (64-bit) | |||||||||||
| Memory Benchmarks | ||||||||||||
| AIDA64 v5.79.4600 | Benchmark that analyses memory bandwidth and latency | |||||||||||
| Gaming Benchmarks (Nvidia GeForce GTX 1080 Ti) | ||||||||||||
| 3DMark | Graphics benchmark run using Fire Strike and Time Spy tests | |||||||||||
| VRMark | Virtual reality benchmark run using the Cyan Room test | |||||||||||
| F1 2017 | 1,920x1,080 and 3,840x2,160, ultra settings | |||||||||||
| Far Cry 5 | 1,920x1,080 and 3,840x2,160, ultra settings | |||||||||||
| Middle-earth: Shadow of War | 1,920x1,080 and 3,840x2,160, ultra settings | |||||||||||
| Total War: Warhammer 2 | 1,920x1,080 and 3,840x2,160, ultra settings | |||||||||||
| Miscellaneous Benchmarks | ||||||||||||
| Power Consumption | To emulate real-world usage scenarios, we record system-wide mains power draw when idle, when encoding video via HandBrake and while playing Far Cry 5 | |||||||||||
Notes
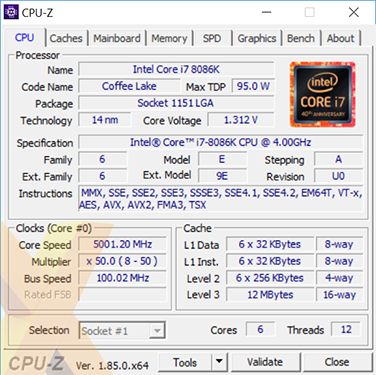
It's worth mentioning that the Core i7-8086K doesn't behave exactly like the Core i7-8700K at default speeds when set to auto configuration in the BIOS. The former chip runs at a solid 4.3GHz all-core speed under all benchmarks, while the Core i7-8700K moves around from an all-core 4.1GHz (on long-duration, predominantly AVX benchmarks) to 4.3GHz (on short-duration benchmarks). This is why you will see slightly different results for both stock-clocked processors in the upcoming graphs.
When running at the 5.0GHz all-core speed mentioned on the previous page, we also increased the memory speed to 3,200MHz with 14-14-14 timings, to better reflect what an enthusiast is likely to do.


