


HEXUS.bang4buck, and power-draw
HEXUS.bang4buck
In a rough-and-ready assessment of the cards' bang per buck, we've aggregated the average 1680x1050 and 1920x1200 frame rates for the three games (Crysis excluded on the grounds that it's a demo), normalised them* and taken account of listed the cards' prices.
But there are more provisos than we'd care to shake a stick at. We could have chosen three different games, the cards' prices could have been derived from other sources and pricing tends to fluctuate daily.
Consequently, the table and graph below highlight a metric that should only be used as a yardstick for evaluating comparative performance with price factored in. Other architectural benefits are not covered, obviously.
| Graphics cards | ATI Radeon HD 3870 512MiB | ATI Radeon HD 3870 512MiB CrossFire | Sapphire Radeon HD 2900 XT 512MiB | MSI NX8800GT-T2D512E-OC 512MiB | MSI NX8800GT-T2D512E-OC 512MiB SLI | ASUS GeForce 8800 GTS 320MiB |
|---|---|---|---|---|---|---|
| Actual aggregate marks at 1680x1050 | 155.71 | 253.28 | 155.51 | 218.9 | 346.81 | 149.16 |
| Aggregate marks, normalised*, at 1680x1050 | 110.59 | 189.36 | 110.06 | 168.24 | 260.37 | 105.61 |
| Actual aggregate marks at 1920x1200 | 132.37 | 218.06 | 131.67 | 181.22 | 298.92 | 122.6 |
| Aggregate marks, normalised*, at 1920x1200 | 91.46 | 164.84 | 91.1 | 133.89 | 222.47 | 74.96 |
| Current price | £140 | £280 | £225 | £168 | £336 | £180 |
| HEXUS.bang4buck score at 1680x1050 | 0.79 | 0.68 | 0.49 | 1 | 0.77 | 0.59 |
| HEXUS.bang4buck score at 1920x1200 | 0.65 | 0.59 | 0.4 | 0.8 | 0.66 | 0.43 |
| Acceptable frame rate (av. 60fps) at 1680x1050 | No (QW, LP) | No (LP) | No (QW, LP) | No (QW, LP) | No (LP) | No (QW, LP) |
| Acceptable frame rate (av. 60fps) at 1920x1200 | No (QW, LP) | No (LP) | No (CoH, QW, LP) | No (CoH, QW, LP) | No (QW, LP) | No (CoH, QW, LP) |
* The normalisation refers to taking playable frame rate into account. Should a card benchmark at over 60 frames per second in any one game, the extra fps count as half. Similarly, should a card benchmark lower, say at 40fps, we deduct half the difference from its average frame rate and the desired 60fps, giving it a bang4buck score of 30 marks. The minimum allowable frame rate is 20fps but that scores zero.
As an example, should a card score 120fps we treat it as 90fps as only half the frame rate above 60fps is counted for the bang4buck - this is the formula: (120-((120-60)/2)). Similarly, should it score 30fps, we count it as only 15fps: (30+((30-60)/2)).
The reasoning behind such calculation lies with playable frame rates.
Should card A score 110fps in a benchmark and card B 160, then card B would otherwise receive an extra 50 marks in our bang4buck assessment, even though both cards produce perfectly playable frame rates and anything above 60fps is a bonus and not a necessity for most.
Similarly, without our adjustments, the aggregated bang4buck total for two very different cards would be identical if, in a further benchmark, card A scored a smooth 70fps and card B an unplayable 20fps. Both would win marks totally 180, yet the games-playing experience would be vastly different.
A more realistic (and useful) assesment would say that card A is better because it ran smoothly in both games - and that view would be accurately reflected in our adjusted aggregation, where card A would receive 150 marks (85+65) and card B 100 (100+0).
In effect, we're including a desired average frame rate, in this case 60, and penalising lower performance while giving frame rates higher than 60fps only half as much credit as those up to 60fps. If this doesn't make sense or you have issue with it, please hit the HEXUS community.
Here's the HEXUS.bang4buck graph at 1680x1050.
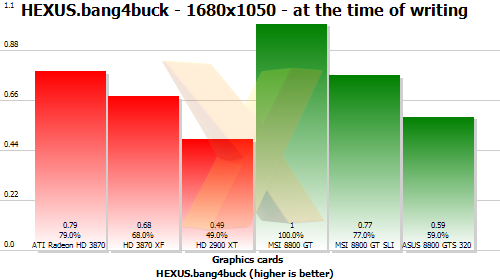
What the graph tells you is that, as far as our benchmarks are concerned, spending a little more on a GeForce 8800 GT is worth the extra outlay.
Had the metric been the same we could have surmised that the extra outlay was compensated for by a linear increase in normalised performance. The very fact that the Radeon HD 3870 matches the HD 2900 XT's performance but undercuts its pricing significantly, is manifested by an appropriately poor HEXUS.bang4buck score for that older card - 0.49.
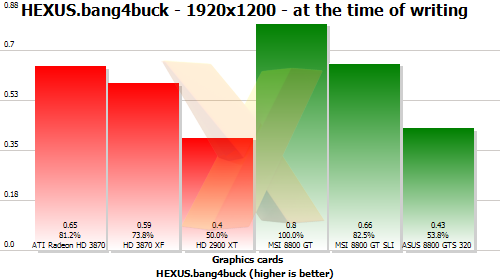
Raising the considered resolution to 1920x1200 reduces the metric but the interpretation remains the same, that is, it's worth spending more on a GeForce 8800 GT because you are more than compensated for the expense by exponentially higher frame rates. Remember, though, non-3D feature are not taken into account.
Power-consumption musings
We measured the power-draw figures with an at-mains watt-meter. The following wattages take the entire system into account and that's why we've measured them all on a single platform, with the only difference being the graphics cards. Load ratings were achieved by running the 3DMark06's Canyon test.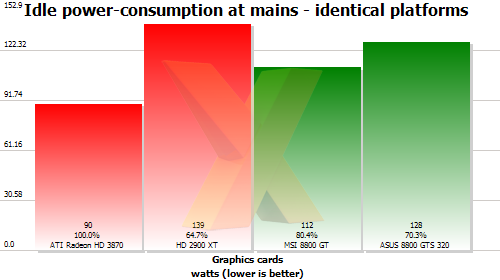
Smaller manufacturing processes are more power-efficient when the cards are idling, clearly.
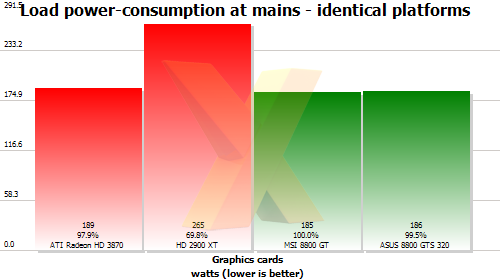
We expect the 80nm-based, wattage-guzzling Radeon HD 2900 XT to look poor when under load. What's interesting is to see the two new SKUs posting very similar at-load numbers to one another. We're also surprised to see the GeForce 8800 GTS 320 being so frugal under load.


